The importance of comprehensive market research
In-depth market research is a fundamental step for any business project, serving as a compass to navigate through market complexities and maximize the chances of success. This article aims to guide you through the various essential components of market research, demonstrating how each element contributes to a complete understanding of your business environment. By detailing the necessary information and its strategic importance, we aim to provide you with the tools to accurately assess the commercial potential of your project, satisfy investors' requirements, and lay the foundations for a successful business.

1. Context of the study
1.1 Subject of the study
When a client is considering establishing a business or purchasing a new property, understanding the context is crucial. A market study must begin with the definition of the subject, including the type of opportunity seized, the concept of the customer, the surface area of the establishment. Even secondary information is necessary, such as opening days or effective implementation date. This contextualization makes it possible to anchor the study in the specific reality of the project and to guide the following analyses.
It is also essential to clarify who is involved in the study. This includes the contact details of the customer contact, the study manager, and the manager within the company responsible for the project. Clear communication between these parties ensures effective data collection and shared accountability.
Throughout your file, it is essential to illustrate your research with maps, photographs, tables, graphs or any other visual elements. This step is necessary because it allows your audience to absorb information much more quickly than a simple text. This is why a geographical representation at several scales (departmental, city, and village) must be present from the subject of study. It provides a visual of the location and its immediate surroundings, facilitating spatial understanding for all stakeholders.

1.2 Target location
Pre-installation photos of the facility and a satellite map of the surrounding area provide a concrete basis for discussing the commercial potential of the location. These visual elements are essential to answer the problem of evaluating the commercial potential of this location. The information provided and our recommendation will make it possible to meet four objectives:
- Evaluate the dynamism of the area,
- Define a catchment area in terms of number of inhabitants,
- Measure the suitability of the point of sale with the customers targeted by the brand,
- Estimate the turnover achievable in the catchment area.

1.3 Environment, accessibility and visibility
Location analysis should consider geographic context, accessibility and visibility. Existing infrastructure and future developments that could improve or compromise access to the site must be assessed. The economic and commercial dynamics of the area indicate the growth potential of the project. Mobility engagement considers transport and accessibility options for residents and visitors, including bus services and parking facilities. Strategic planning advises on measures to take to maximize the impact of the project, such as signage at key points.
You can illustrate this part with photos based on the different axes of visibility of the premises and the main roads around the establishment.
1.4 Catchment area
Clearly defining the catchment area (represents the geographical area of influence), is crucial to understanding where the main customers will come from. This helps to adapt business strategies and estimate the potential market in terms of number of inhabitants. Segmenting this area into primary, secondary, and tertiary helps in effectively targeting marketing efforts. These different zones can be distinguished in this way:
- The primary zone corresponds to an average access time to the site of 15 minutes,
- The secondary zone corresponds to an access time of approximately 30 minutes by car,
- The tertiary zone represents an access time of approximately 45 minutes by car, reworked to correspond to the commercial structure.

2. Socio-demographic and economic data
2.1 Population
When evaluating a potential site for an amusement park, understanding the demographic makeup of the area is essential. A description of the municipality and region includes not only the total number of inhabitants, but also a breakdown by city and large nearby centers, indicating the travel time required to reach them. It is crucial to document the accurate number of residents and households, including projections of future urban developments that may increase the population. The analysis must also include the predominant age segments and average socio-professional categories, to allow a more precise adaptation of the offers and services offered by the park.
You can illustrate this part by resuming the previous catchment area, this time in a heat zone indicating the population density by zone. A table accompanies the maps indicating the number of population or households over different years in relation to the targeted areas, total area, the region and mainland France.

2.2 Distribution of the population by age
A detailed analysis of age distribution is necessary to tailor activities and promotions to key demographic groups. It is useful to reproduce tables comparing primary, secondary, and tertiary zones to the region and to metropolitan France, presenting the total population for defined age segments (0-14 years, 15-29 years, etc.) , both in absolute numbers and in percentages. This analysis helps identify target age groups for specific activities or marketing campaigns.
2.3 Families
The study of family structures in the catchment area makes it possible to target promotions and services adapted to families with children, couples, or single-parent households. A detailed analysis should include a table dividing family types (with or without children, number of children, etc.) and a pie chart illustrating this distribution, which helps in planning specific events and offers.
2.4 The distribution of socio-professional categories
Socio-professional categories can greatly influence the type and price of services offered. The tables describing the distribution of the different professional categories (craftsmen, executives, employees, etc.) in the areas analyzed make it possible to adjust the offer to correspond to the spending capacities and interests of the customers.
2.5 Median income
Understanding the median income per consumption unit in the catchment area is crucial for defining price levels and service offerings. A comparative table of these incomes, accompanied by a comparison index with the national average and the percentage of households in the CSP+ category (socio-professional category), makes it possible to effectively target pricing and marketing strategies.
2.6 Employees
A heat map analyzing employee density and a description of major employers provide insights into customer potential during working hours. Supplementing this analysis with a table showing the number of employees and the ratio per 100 inhabitants helps to assess the potential for visits during working days, particularly for post-work relaxation offers.
2.7 The motorization rate
Evaluating the motorization rate can influence decisions relating to the provision of parking lots and access options to the site. A table showing the percentage of households with vehicles in the catchment areas gives a clear indication of the infrastructure and transport service needs to access the site.
2.8 Typology of IRIS
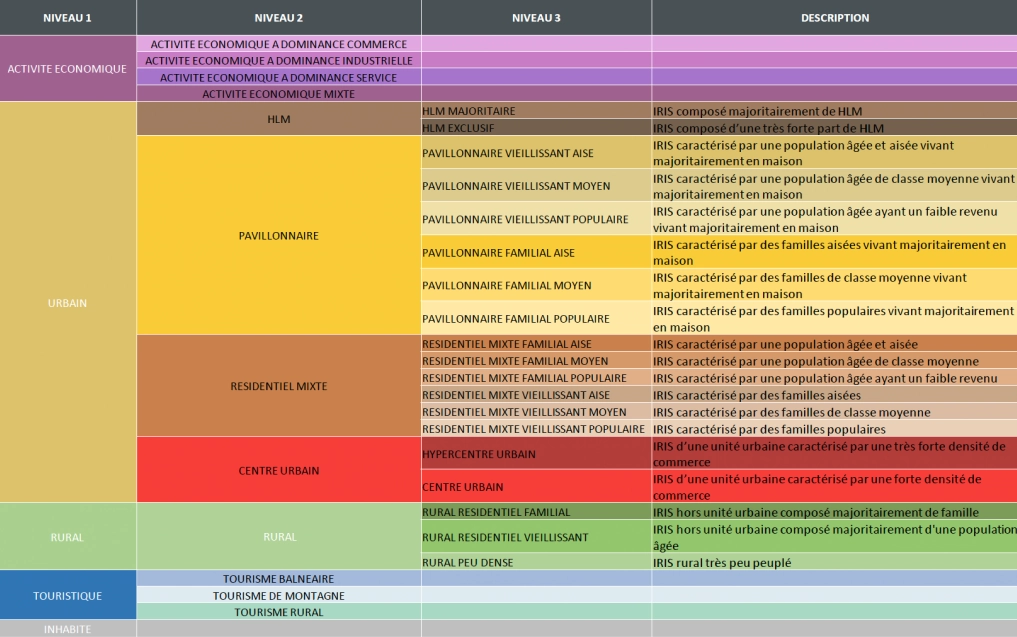
This section should analyze in depth the population typologies according to the IRIS (The IRIS each constitute a “micro district”, composed of a set of contiguous and homogeneous blocks, bringing together 2,000 inhabitants or more) to better understand the micro-markets within the catchment area. Detailed maps and descriptions of dominant population segments (e.g. mixed residential, family suburban) help personalize the marketing approach and product development.
3. Urban Dynamics
3.1 Schools
The analysis of educational establishments near a leisure site offers a direct insight into the potential for attendance by young people and families. The presence of primary schools, middle schools, high schools and higher education establishments within a reasonable distance can significantly increase daily attendance, particularly after school hours.
It is important to map these establishments and calculate the average access time on foot or by public transport to assess their potential impact. Additionally, this data helps develop strategic partnerships with institutions for special events, promotions or after-school programs.

3.2 Shopping areas
Nearby commercial areas play a key role in attracting visitors. By identifying major shopping centers, independent boutiques, and local markets, one can assess the flow of potential customers. Detailed maps of these areas must include the type of businesses present, their total sales area, as well as peak traffic times. This analysis not only helps predict visitor volume but also determines the optimal opening hours of the leisure park. In addition, this makes it possible to align the park's promotional offers with peak periods in commercial areas.

3.3 Employment centers
Nearby employment centers constitute an important source of customers, particularly for leisure activities that target adults. The maps should indicate the location of the main employers, the number of employees, and the sectors of activity. This information makes it possible to develop targeted offers such as team building packages, discounts for after-work events, or special events for professionals. Additionally, understanding home-to-work flows can help optimize marketing campaigns and strategically place signage to maximize visibility to employees in transit.
4. Competition, leisure space
4.1 Direct and indirect competitors
It is fundamental to understand both direct (offering similar services) and indirect (other forms of leisure that are not similar but competitive for consumers' time and money) competitors. A detailed map of their location helps visualize the competitive landscape and identify saturated areas or underserved market niches.

4.2 Main competitors
Documenting the main competitors with precise information on their size, services offered, pricing, opening hours and traffic helps to evaluate their performance in the market and to identify best practices and gaps in the current offering.
We advise you here to present your documentation in the form of a map to represent each competitor, trying to define as many criteria as possible.
Ideally your card should contain this information:
- The name
- The address
- The activity
- The price
- Rating and number of reviews
- Turnover
- Opening hours and attendance
- The surface area of the establishment
- A brief description of their activities

4.3 Turnovers in the sector
Analyzing revenue figures published by companies in the same industry gives a valuable indication of market potential and market saturation. This economic data is essential to construct realistic financial forecasts for the new site.
5. Summary and recommendations
5.1 Attractiveness assessment
A synthesis of environmental, demographic and competitive factors provides a comprehensive view of site attractiveness. This overall assessment helps refine marketing and development strategies to maximize the project's commercial impact.
5.2 Survey result
Surveys of local residents can reveal valuable insights into the preferences and behaviors of potential consumers, thereby guiding service offering and communications decisions.
To carry out this survey you can ask a series of questions, for example:
- Would you and your household use a [your business] complex in [your geographic area] if it were available today?
- What types of activities in [your sector of activity] would you be interested in?
- What types of activities in [your secondary sector] would you be interested in?
- How many kilometers would you be willing to travel to enjoy [your activity]?
- How often do you plan to use these activities?
- How much would you be willing to spend on these activities?

5.3 Theoretical market and business potential
The combination of the data collected makes it possible to realistically estimate potential turnover and identify the main activity levers for the planned site. A methodical approach to breaking down the target market and the envisaged capture rates clarifies the objectives to be achieved.
To estimate the potential turnover of a project, we rely on a set of elements impacting the potential level of activity:
Recomposition of the leisure market in the location (enabling the estimation of a capture rate per establishment and an average number of sessions per day)
- Identification of actors and classification by typology
- Average price
- Turnover
- Opening day
- Available area
Estimated capture rate of the project (allowing the project's footprint to be estimated)
- The frame of the target
- The commercial potential inherent in the targeted location (attractiveness, visibility, flow, nearby environment, accessibility, etc.)
- Analysis of the competing offer, both at the scale of the agglomeration and the region, with, among other things, the level of turnover achieved by competitors, when the information was available
- The socio-demographic structure of the defined catchment area
- Definition of the concept: Source (to be defined), Area (to be defined), supply (to be defined)
6. Appendices
6.1 The leisure market
To complement the market research, it is beneficial to provide a general overview of the leisure market. This includes the analysis of consumption trends, customer segment preferences, price developments, and the average budget spent by households on these activities. A detailed analysis helps position the site strategically within the broader context of the national market, identifying sector-specific opportunities and challenges.
6.2 Typology of IRIS
The typology of IRIS (Ilots Regroupees pour l'Information Statistique) makes it possible to break down demographic and economic data at a very localized level. Understanding this distribution helps to precisely target marketing initiatives and services according to the particularities of each area. A detailed table of this typology, associated with maps, offers valuable insights for the development and targeted promotion of the activity.

Conclusion
In conclusion, carrying out a comprehensive market study is an essential step that sets the stage for the commercial success of any project. It allows you to deeply understand your target market, identify challenges and opportunities, and develop effective strategies to meet your customers' needs while remaining competitive.
Well-executed market research provides a clear vision that guides investment decisions and marketing initiatives, ensuring a grounded and measured approach to launching and growing your business.
Thanks to this strategic tool, you can better anticipate market trends, adapt your offers accordingly, and increase your chances of long-term success.
Discover our other articles
I wish to be contacted again
Would you like to be put in touch with a leisure advisor?
Don't wait any longer to share your telephone number and area code with us.


